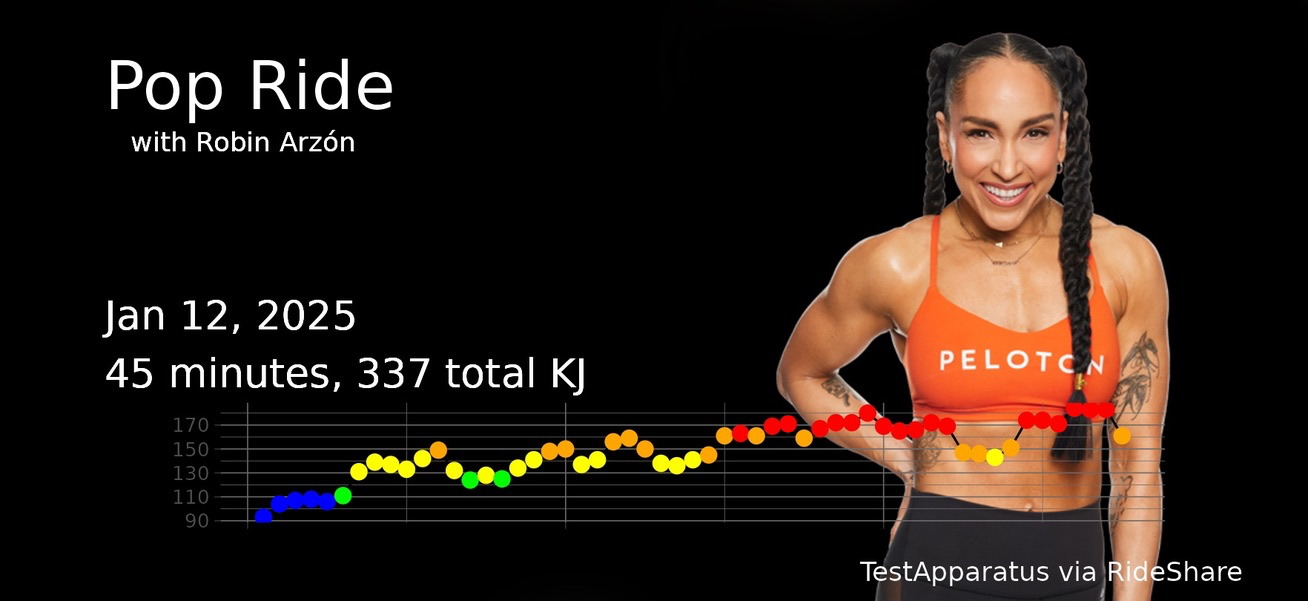
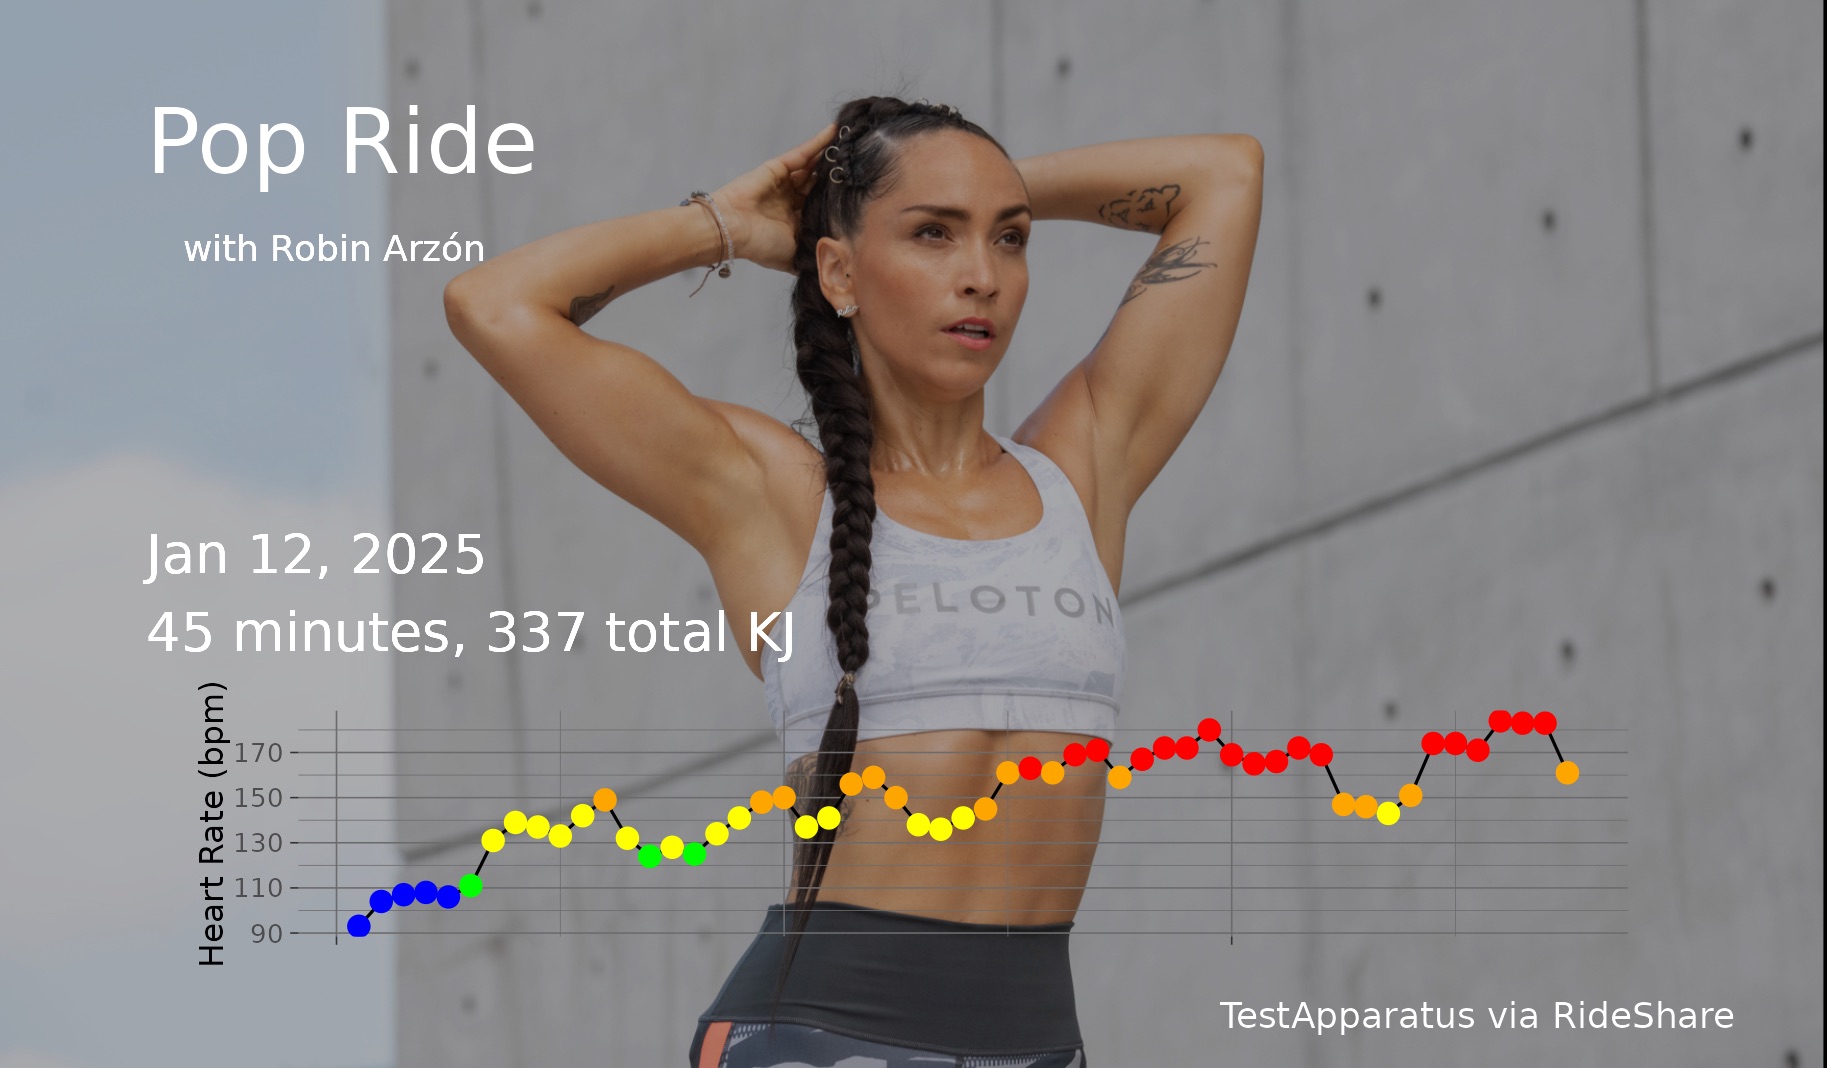
I made a really satisfying update to one of my Shiny apps today. RideShare is a small Shiny app born from a desire to produce nice-looking shareable images from my Peloton rides.1 It shows a bit of my recent ride history, and after selecting a recent ride, displays an image of the ride’s instructor superimposed with some of the ride information, including a mini plot of my heart rate through the ride.
The Peloton API returns several instructor images, and I wanted some flexibility in the app to choose which one to display. Wiring that into the UI and the server component was really easy. I just added a radio button to the UI:
ui.R
sidebarLayout(
...
radioButtons("background_selector",
  label="Instructor graphic style:",
  choices=c("jumbotron", "lifestyle", "none"),
  selected="jumbotron")
And then update the server code that produces the plot. I’m assigning an image URL from those available in the ride data, based on the type selected by the user. The API returns several identical images for each type, so I’m selecting the first one.
output$rideCard <- renderPlot({
...
if (input$background_selector == "jumbotron") {
  bg <- tile$instructor.jumbotron_url_dark[1]
}
if (input$background_selector == "lifestyle") {
  bg <- tile$instructor.life_style_image_url[1]
}
if (input$background_selector == "none") {
  bg <- tile$instructor.workout_share_images[[1]]$image_url[1]
}
bgImage <- magick::image_read(bg)
...
plot <-
  ggdraw() +
  draw_image(bgImage,
    hjust = 0, halign = 0, valign = 0) +
  draw_plot(p, .1, .10, width=.8, height=.25)
}, width=588, height=270)
p here is the heart rate plot produced earlier in the function. The decimal values are positioning it at proportional locations on the x and y axis of the larger background. And the width and height options after the expression provide dimensions for the output.
I know, case_when would look a lot cleaner for those assignments, but I expected I might want to set more values based on the image type selection, and that turns out to be exactly what I need: Because the images aren’t all the same size, funny scaling effects can happen. So the thing I learned how to do today is to set the plot output size dynamically.
You can’t just set the height and width dynamically based on a value found in the plot expression, because those reactive values aren’t available outside of the context. Those parameters can be set using a function that does have access to the reactive values. So the updated chunk in the renderPlot goes like this:
card_height <- function() {
return(reactive(globaldata$card_height))
}
card_width <- function() {
return(reactive(globaldata$card_width))
}
output$rideCard <- renderPlot({
...
if (input$background_selector == "jumbotron") {
bg <- tile$instructor.jumbotron_url_dark[1]
globaldata$card_width = 588
globaldata$card_height = 270
}
if (input$background_selector == "lifestyle") {
bg <- tile$instructor.life_style_image_url[1]
globaldata$card_width = 609
globaldata$card_height = 356
}
if (input$background_selector == "none") {
bg <- tile$instructor.workout_share_images[[1]]$image_url[1]
globaldata$card_width = 600
globaldata$card_height = 315
}
bgImage <- magick::image_read(bg)
...
plot <-
ggdraw() +
draw_image(bgImage,
hjust = 0, halign = 0, valign = 0) +
draw_plot(p, .1, .10, width=.8, height=.25)
}, width=card_width(), height=card_height())- 1
- These two new functions will make the dimensions available outside the reactive context.
- 2
- These height and widths match the source images and are assigned to a reactive variable
- 3
- And now we can assign the height and width using the functions that can access them
Cool! I can now toggle the radio button for either type of image, or even not use one at all. And the output size will adjust to the source image so I won’t have any odd scaling or background showing through.
With this flexibility I can also much more easily experiment with the other images that the API sends back, and if/when the API results change, I can adapt to a new image size or format with lots less trouble than last time.